The Price of a Model Pull: Benchmarking a Cache at the Syscall Floor
The most expensive thing a GPU can do is nothing. Every time a training node, a CI job, or an inference pod pulls a model from the internet, the accelerators attached to it sit idle for the duration of the download. That idle time is the real price of a model pull — and it is paid again on every node, every restart, and every retry.
The arithmetic
The numbers are easy to reconstruct for any fleet. Take an 8-GPU training node billed around $32/hour and a 140 GB model. Pulled over the public internet at a typical sustained 40 MB/s, that download takes roughly an hour — about $32 of accelerator time spent waiting, per node. Scale the same cold start across a 32-node cluster and a single model rollout costs on the order of a thousand dollars in idle hardware, before a single token is processed. The figures are illustrative; the shape is not. Download time scales with fleet size, and the internet does not get faster because your cluster got bigger.
A pull-through cache changes the shape. The first request streams from upstream once; every request after that is served from local disk inside your own network. The recurring cost collapses from fleet size × internet bandwidth to one upstream pull + local wire speed. At that point the interesting engineering question becomes: how fast can the warm path actually go?
The floor, not the ceiling
Pulsys's answer is to engineer the warm hit down to the theoretical minimum. To serve bytes over a network, something must cross the user/kernel boundary at least once — so the target is exactly one crossing per response, with zero userspace copies and zero allocations on the hot path.
- On Linux 6.1+, warm hits are served through
io_uring: the HTTP response head and the file body are submitted as linked operations the kernel executes as one sequence. - On macOS, Darwin's
sendfile(2)accepts ansf_hdtrheader list, which fuses headers and body into a single syscall. The full journey from the defaultnet/httploop to that fused call is documented inan earlier post. - In-flight range de-duplication means concurrent requests for the same bytes trigger one upstream fetch, not many.
The verification matters as much as the design. Bracketing a warm run with expvar counters shows exactly 1.000000 fused syscalls per cache hit, and an allocation profile captured at MemProfileRate=1 attributes nothing to the serve path — the hot path is invisible to the profiler because it no longer allocates.
# 3s of 256 KiB warm hits under wrk
pulsys_cache_hits           +93,467
pulsys_sendfile_fused_calls +93,467    # 1.000000 sendfile/hit, 0 EAGAIN retries
What that buys, measured
On the committed reference run — a stock c7i.12xlarge(48 vCPU, kernel 6.1.176-221.360.amzn2023.x86_64) — the io_uring warm path sustains1.36M req/s at 4 KiB and90 GB/s loopback at 16 MiB. Those artifacts are machine-generated by the benchmark harness and committed as-is; the README headline is rewritten from headline.json, not typed by hand.
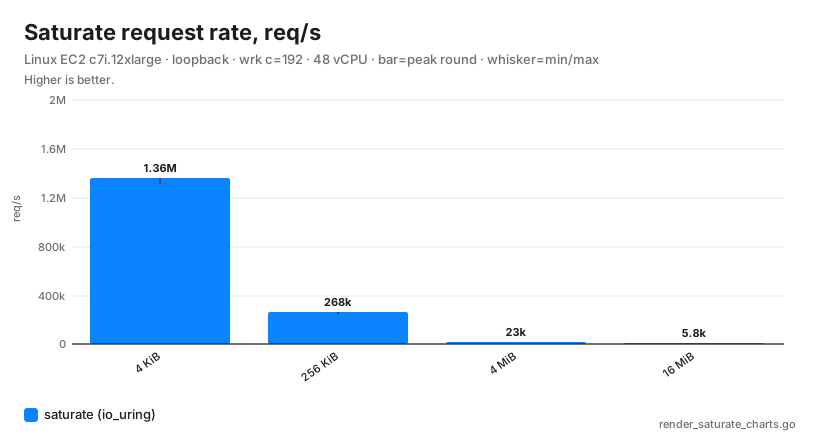
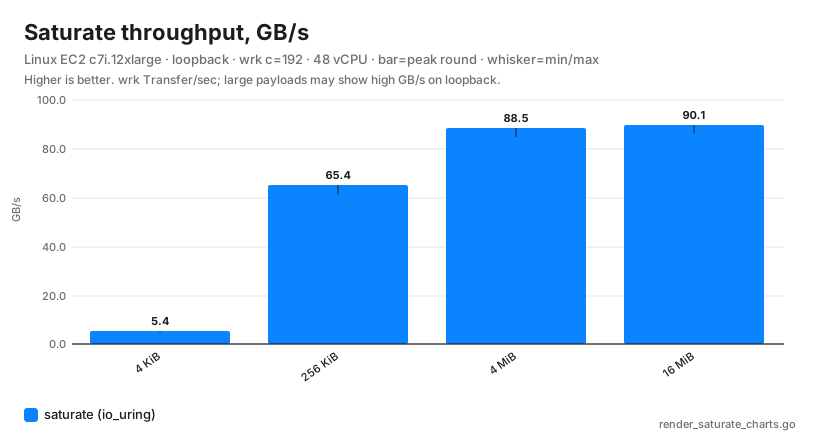
The end-to-end effect is what a fleet actually feels. On the same instance, a realhf download of Qwen2.5-7B-Instruct — 15.2 GB through the officialhf CLI with hf_transfer — completes in 22 s against the warm cache: 664 MiB/s sustained to a single client that is writing every byte to disk, with zero upstream egress. That run is what the terminal demo on the landing page replays; the rate in it comes from the harness CSV, not a copywriter. The gap between 664 MiB/s for one downloader and 90 GB/s aggregate is the point of the saturation charts above: one client is bounded by its own disk and HTTP client, while the cache has two orders of magnitude of headroom left to serve the rest of the fleet at the same time.
Run the benchmarks yourself
Benchmarks you cannot reproduce are marketing. Everything above ships in the repo with the harnesses that produced it.
Local comparison (Darwin or Linux), same bytes and URLs across proxies:
scripts/bench_compare.sh            # warm-hit throughput vs other local proxies
go run scripts/render_bench_svg.go  # renders the comparison chart
Any Linux host (kernel ≥ 6.1) can measure the io_uring path directly — and verify it engaged, because io_uring falls back silently when it can't:
go build -o /tmp/pulsys ./cmd/pulsys
/tmp/pulsys -listen 127.0.0.1:8080 -public-base-url http://127.0.0.1:8080 \
  -cache-dir /tmp/pulsys-cache -listeners "$(nproc)" \
  -iouring -tcp-cork=false -admin-listen 127.0.0.1:18099 &

curl -s http://127.0.0.1:18099/debug/vars | grep io_uring_fused
#   "pulsys_io_uring_fused_calls": 42        <- > 0 means engaged
The full EC2 harness is how the committed results/ec2/artifacts are produced: a Packer-built AL2023 AMI with the binary and sysctls baked in, deployed by CDK, driven over SSM (no SSH, no long-lived keys), torn down with one script.
scripts/build-stock-ami.sh
cd infra/cdk && npx cdk deploy -c amiKind=stock --require-approval never && cd -
scripts/ssm-bench.sh variant=saturate-iouring duration=30s
scripts/ssm-teardown.sh
The complete methodology — including how to verify io_uring engagement and why a Docker run is a functional check rather than a benchmark — is in thebenchmarks doc, with the syscall-level design ininternals.
Try it
Pulsys is open source under Apache-2.0. The whole stack — proxy, admin console, Postgres — comes up with one docker compose up, and any Hugging Face client works unchanged via HF_ENDPOINT.